Perth as an isometric map: every inner-city building, drawn from open data
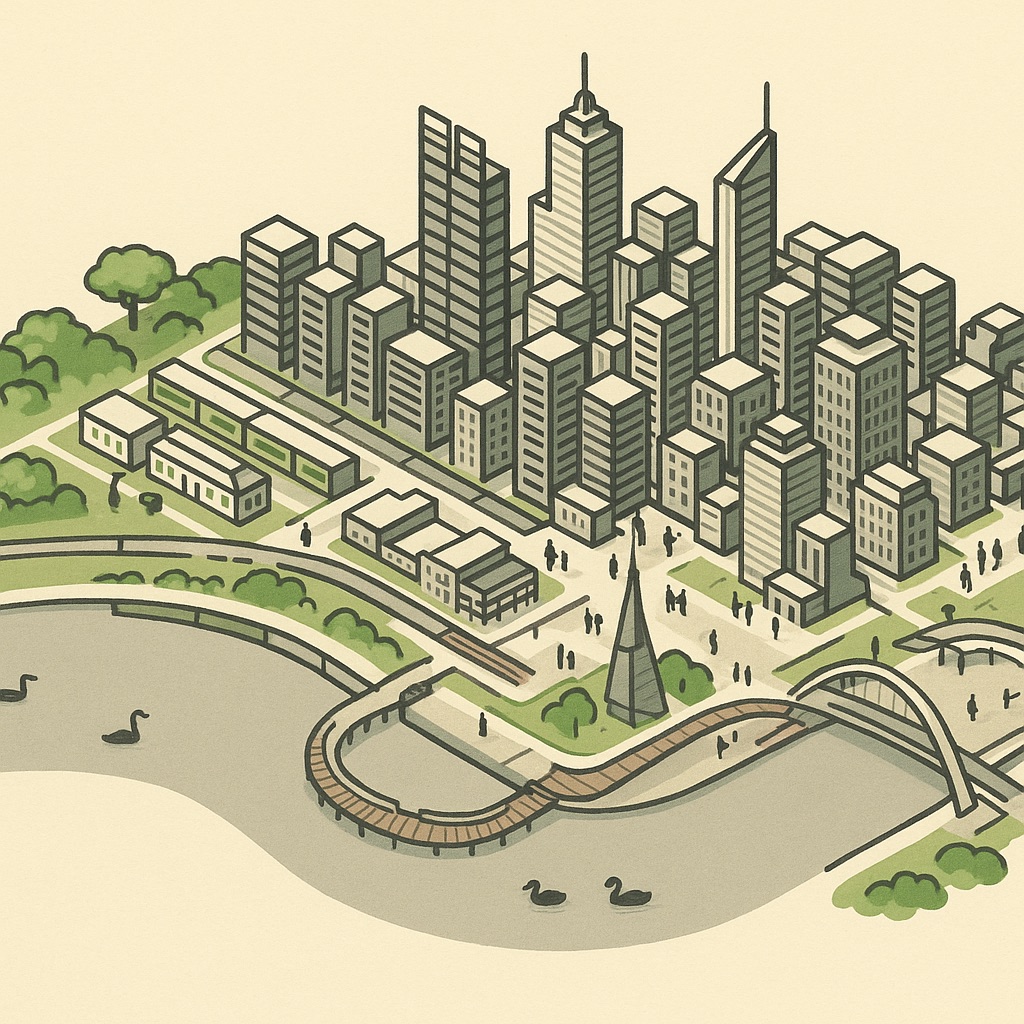
Pixel Perth is a map of the inner city drawn the way a city-builder game would draw it: every building is a box extruded from its real footprint, the Swan River is the flat blue shape everything else arranges itself around, and the businesses sit inside the buildings they actually occupy. Nothing on it is illustrated by hand. The footprints, the heights, the shop names and the river all come from OpenStreetMap and a handful of other open datasets, and the map is redrawn whenever that data changes.
What the map is
Under the hood it is a piece of geometry, not a picture. Each building outline is projected into local metres, rotated onto an isometric grid and painted onto a canvas in the browser, tile by tile, in the order that lets taller things hide the things behind them. There is no map server, no tiles fetched from someone else, and no third-party mapping library: the whole renderer is a few thousand lines of code written for this one purpose. That is why the map loads as a single page, why it works offline once a suburb has loaded, and why it looks the same on a phone as it does on a large screen.
Click any building and a card opens listing what trades inside it. Where a business owner has claimed their card, the card carries the hours, contacts and photos they supplied; everywhere else it carries whatever OpenStreetMap knows, which is often surprisingly complete in Perth’s inner suburbs and sometimes just a name.
Inner Perth, not the metro area
Greater Perth runs for the better part of a hundred kilometres from Two Rocks to Mandurah, most of it single-storey houses on generous blocks. An isometric map of that would be a field of identical small boxes with nothing to look at. So the map is built around the part of the city where the buildings stand close together and vary in height: the CBD and Northbridge at the centre, East Perth and Burswood across the river, South Perth and Victoria Park on the south bank, and the ring of older suburbs from Subiaco and Leederville around to Mount Lawley, Maylands and Belmont. The boundary is a rectangle chosen around building density, not a council line — the City of Perth alone would have been too small, and the metro area far too big.
Why the CBD leans and the suburbs don’t
Look at the centre of the map and the CBD blocks sit at a slight angle to everything around them. That is not a rendering quirk. The city grid was laid out in 1829 along the river bank, so St Georges Terrace, Hay Street and Murray Street run roughly west-south-west to east-north-east, following the shore of Perth Water. The suburbs that grew up later were surveyed on the cardinal grid instead, so the streets of Subiaco, Leederville, Victoria Park and Mount Lawley run close to true north and true east.
An isometric map has to pick one orientation for its axes. We aligned them with the cardinal grid, because most of the covered area is suburb rather than CBD and because it keeps north pointing up and to the right, the way it does in the games this map borrows its look from. The CBD then leans by about twenty degrees, and because every building is drawn from its true footprint rather than snapped to the tiles, the lean reads as what it is: the oldest part of the city, on the river’s terms rather than the surveyor’s.
Where the heights come from
OpenStreetMap lets mappers tag a building with its number of storeys or its height in metres. Where either tag exists, the map uses it, so the towers along St Georges Terrace and the apartment blocks in East Perth rise to something close to their real height. Where neither exists — and in Perth that is most houses — the map falls back to a sensible default for the building type: a house is drawn as a house, a shed as a shed, a warehouse as a low wide box.
This is worth being honest about, because Perth’s share of buildings with a recorded height is lower than in the east-coast cities. The skyline is right; the suburbs are drawn at a plausible uniform height rather than a surveyed one. The fix is the one OpenStreetMap was designed for: if you know how many floors your building has, add it to the map and the next monthly refresh will pick it up.
- Buildings, roads, the river and parks — OpenStreetMap, refreshed monthly.
- Businesses — OpenStreetMap shop and amenity tags, cross-checked against the Australian Business Register where a name matches.
- Addresses — G-NAF, the national address file.
- Suburb figures — the ABS 2021 Census, at suburb level.
Licences, credit and corrections
Everything the map is built from is open, and the licences are the reason it can exist. OpenStreetMap data is published under the Open Database Licence, which is why “© OpenStreetMap contributors” appears at the foot of every page and why corrections flow back the other way: when an owner claims a card and fixes a name or a phone number, the fix is contributed to OpenStreetMap rather than kept here. Government datasets are used under Creative Commons Attribution, and each one is credited by name on the about page. The map carries no advertising and no analytics scripts; what it knows about you is what the server log knows, and no more.
If a building is missing, a shop is in the wrong box, or a suburb boundary looks wrong, the most useful thing you can do is fix it at the source. OpenStreetMap accepts edits from anyone, and Perth’s mappers are an active bunch. The map you see here is only ever as good as the map they keep.